Relative Advantage of Using Spreadsheets and Databases
General Information
Can spreadsheets and databases be used in teaching English? Until this week, I thought that probably not. To be honest, I hardly even gave it any thought! It is not surprising than that, being as an ESL teacher, I have never integrated spreadsheets and databases in my teaching. In fact, I always thought using those types of software would be more appropriate and applicable to majors such as accounting, math, or calculus, but not to ESL or communication. This week's assignment proved the opposite (even though it was not an easy one!) It turned out that using spreadsheets and databases can be extremely useful in teaching any subject, ways beyond math and science!
Relative Advantage of Using Spreadsheets and Databases in Teaching & Learning
According to Roblyer and Doering (2012), spreadsheets "offer benefits for both productivity and teaching practices" (p.125). While these authors admit that the most common uses of spreadsheets and databases are for "keeping club and classroom budgets, preparing performance checklists, and keeping gradebooks", they also state that these software can effectively be used in such fields as "social studies and language arts" (Roblyer & Doering, 2012, p. 125.)
The following are some of the benefits discussed in the text:
- Save time: allows quick calculations and recalculations of grades or budgets.
- Organize displays of information: design informational charts and graphs and store data in columns.
- Support asking "what if" questions - help immediately visualize any changes in numbers.
- Increase motivation to work with mathematics: add the element of "fun" into a traditionally perceive as "boring" subjects (such as math.) (Roblyer & Doering, 2012, p. 122)
Database Software
According to Roblyer and Doering (2012), Database software are simply computer programs that "allow users to store, organize, and manipulate information, including both text and numerical data" (p. 152.) Even though this type of software can also perform some calculations, its major advantage, according to the authors, is in allowing its users to find necessary information by using keywords (152.) Moreover, the authors inform that while database software has mostly been used in science and social studies, it, in fact, can easily be integrated into a "variety of topics across the curriculum" (Roblyer & Doering, 2012, p. 152.)
The following are some of the strategies discussed in the text:
- Teaching research and study skills: as much of the world's information is stored in databases, such "information banks" are more and more available to students on a regular basis.
- Understanding the power of information "pictures": allows students to do their own "data mining", i.e., to recognize "hidden patterns" in a group of data through understanding of how information is organized.
- Posing and testing hypotheses: solving problems through problem-solving activities such as formulating questions and answering them. (Roblyer & Doering, 2012, p. 154.)
Spreadsheet and Database Integration Strategies
1. Class Survey:
I conduct such surveys every semester in order to collect information about my students. However, I used to use printed papers as well as class time. Having completed this assignment, I now plan on collecting such (or similar) data electronically. In addition, I will introduce how to collect and store information using Excel spreadsheets to my students.
2. Spelling Practice Exercise - click this link to view the source.
Using spreadsheets to practice spelling can be an engaging (and fun!) way for students to work with new vocabulary. Not only such practice will allow to improve spelling; indeed, students will be able to return to spreadsheets periodically and use them as a semester/unit long vocabulary log.
3. Essay Rubric - click this link to view the source.
I plan on starting using such rubrics (i.e., created in Excel) for both teacher and peer review and expect it will allow a more productive and effective storing and manipulating with information.
4. Creating a Timeline - click this link to view the source.
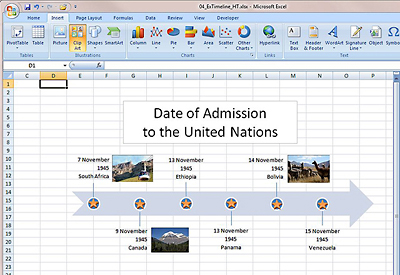
Image source: http://www.microsoft.com/education/en-us/teachers/how-to/Pages/timeline.aspx
Text, Art graphics, and images create visual elements for a timeline. Using the Office Excel 2007 grid allows to accurately layout and align the elements. Students can even build a timeline with pictures rather than with words. Check this link for more ideas!
As I often have my students create a variety of timelines, I found this particular idea quite interesting and useful!
More Ideas on Spreadsheet and Database Integration:
Integration of Spreadsheets and Databases: Part II
Sample Lesson Plan:
Topic: US Culture and Demographics
General Overview: The purpose of this lesson is for students to conduct research on one of the US States (according to their personal interest.) Questions to consider: What region is this state located in? What is its flag and what does it display? What is the state's motto? Why? When did this state join the Union? What are some of the state's cultural and demographic aspects? Specifically, research on the population grow/decline between 1900-2011. What tendencies did you notice? How can they be explained?
Learning Objectives:
1. Students will conduct research on demographics in 5 US states between 1900-2011 (in groups of five, one state per student.)
2. Students will organize their findings using Excel spreadsheets.
3. Students will create graphs using Excel spreadsheets.
4. Students will present their findings and graphs to other classmates.
5. Students will describe their classmate's graphs to complete writing assignments.
6. Students will research for possible reasons for the population growth/decline to support their findings.
7. Students will write compare-contrast essay and analyze the date.
8. Students will write a paragraph/essay based on their findings; they will also to write a description of the graph(s) - the activity they will have to perform when they take a TOEFL or IELTS tests.
References:
Google Docs: Essay Rubric template: http://library.thinkquest.org/J0110054/Classroom_Activities.html
Roblyer, M. D., & Doering, A. H. (2012). Integrating educational technology into teaching (6th ed.). Allyn & Bacon.
Spelling Test: http://library.thinkquest.org/J0110054/Classroom_Activities.html
Images: Google Images